

On this page
- License utilization formula
- 2026 license utilization benchmarks
- Why license utilization matters for customer health
- License utilization and renewals
- Challenges in measuring license utilization
- License utilization vs adoption — what's the difference?
- Build your customer health score
- FAQ
- Related customer health metrics
License Utilization is the percentage of purchased SaaS seats a customer is actively using, calculated as (Active Users ÷ Licensed Seats) × 100. The healthy range for mature B2B SaaS is 60–85% — below 50% signals likely churn risk, above 90% signals expansion opportunity. License utilization is one of the most predictive leading indicators in a composite customer health score: it surfaces account-level risk and expansion signals 30–60 days before they show up in NPS, CSAT, or renewal conversations.
This guide covers the formula, 2026 benchmarks by SaaS segment, how license utilization feeds a composite customer health score, and how it shapes renewal and expansion conversations.
License utilization formula#
License Utilization (%) = (Active Users ÷ Licensed Seats) × 100The two inputs both need definitions:
- Active Users — users who logged in (or performed a meaningful action) inside a chosen window. Monthly is the most common; weekly is stricter and a better leading indicator. Define "active" once and use it consistently.
- Licensed Seats — the number of paid seats on the contract. For unlimited-seat or concurrent-user contracts, substitute "provisioned accounts" or "peak concurrent users" respectively.
A worked example: a customer is on a 100-seat plan and 62 distinct users logged in last month. License Utilization = (62 / 100) × 100 = 62% — squarely in the healthy band for a mature SaaS product, but trending toward the lower edge. If the same account drops to 38 active users next month, utilization is 38% — well below the 50% at-risk threshold, and an account manager should be paged.
2026 license utilization benchmarks#
The healthy range depends on the product category. A collaboration tool every employee opens daily should sit much higher than a specialist BI seat that only analysts touch. Cross-industry research from ServiceNow, Zylo, and Flexera converges on the ranges below.
| Customer segment | 2026 healthy utilization | At-risk threshold |
|---|---|---|
| Mature B2B SaaS (per-seat) | 60–85% | <50% |
| Collaboration / productivity (Slack, Zoom-class) | 70–90% | <60% |
| Specialist / power-user tools (BI, design, dev) | 50–75% | <35% |
| Enterprise IT platforms (Entra, Salesforce) | 40–70% | <30% |
| Cross-industry SaaS average | ~62% | — |
Sources: ServiceNow (38% of SaaS licenses go unused, 2026), Zylo SaaS Management Index, Flexera State of ITAM 2026, CloudFuze license utilization research.
The single most-cited 2026 data point — ServiceNow's finding that 38% of SaaS licenses go unused — is the strongest argument for tracking utilization at the account level. Aggregate "we paid for X seats" reporting hides which accounts are bleeding value; per-account utilization surfaces it.
Why license utilization matters for customer health#
High license utilization suggests a customer is finding value in the product, is likely to renew, and is a candidate for seat expansion. Low license utilization is one of the earliest churn signals on the market — it consistently ranks among the top metrics to predict customer churn, typically detectable 30–60 days before satisfaction scores (NPS, CSAT) move, and 60–90 days before the renewal conversation. That lead time is exactly what a Customer Success motion needs.
Specifically, license utilization helps Customer Success and RevOps teams:
- Catch at-risk accounts early. A 100-seat customer dropping from 70% to 38% utilization across two months is a churn signal long before any survey would catch it.
- Quantify expansion potential. A 100-seat customer running at 95% utilization with monthly new-user growth is a textbook upsell candidate.
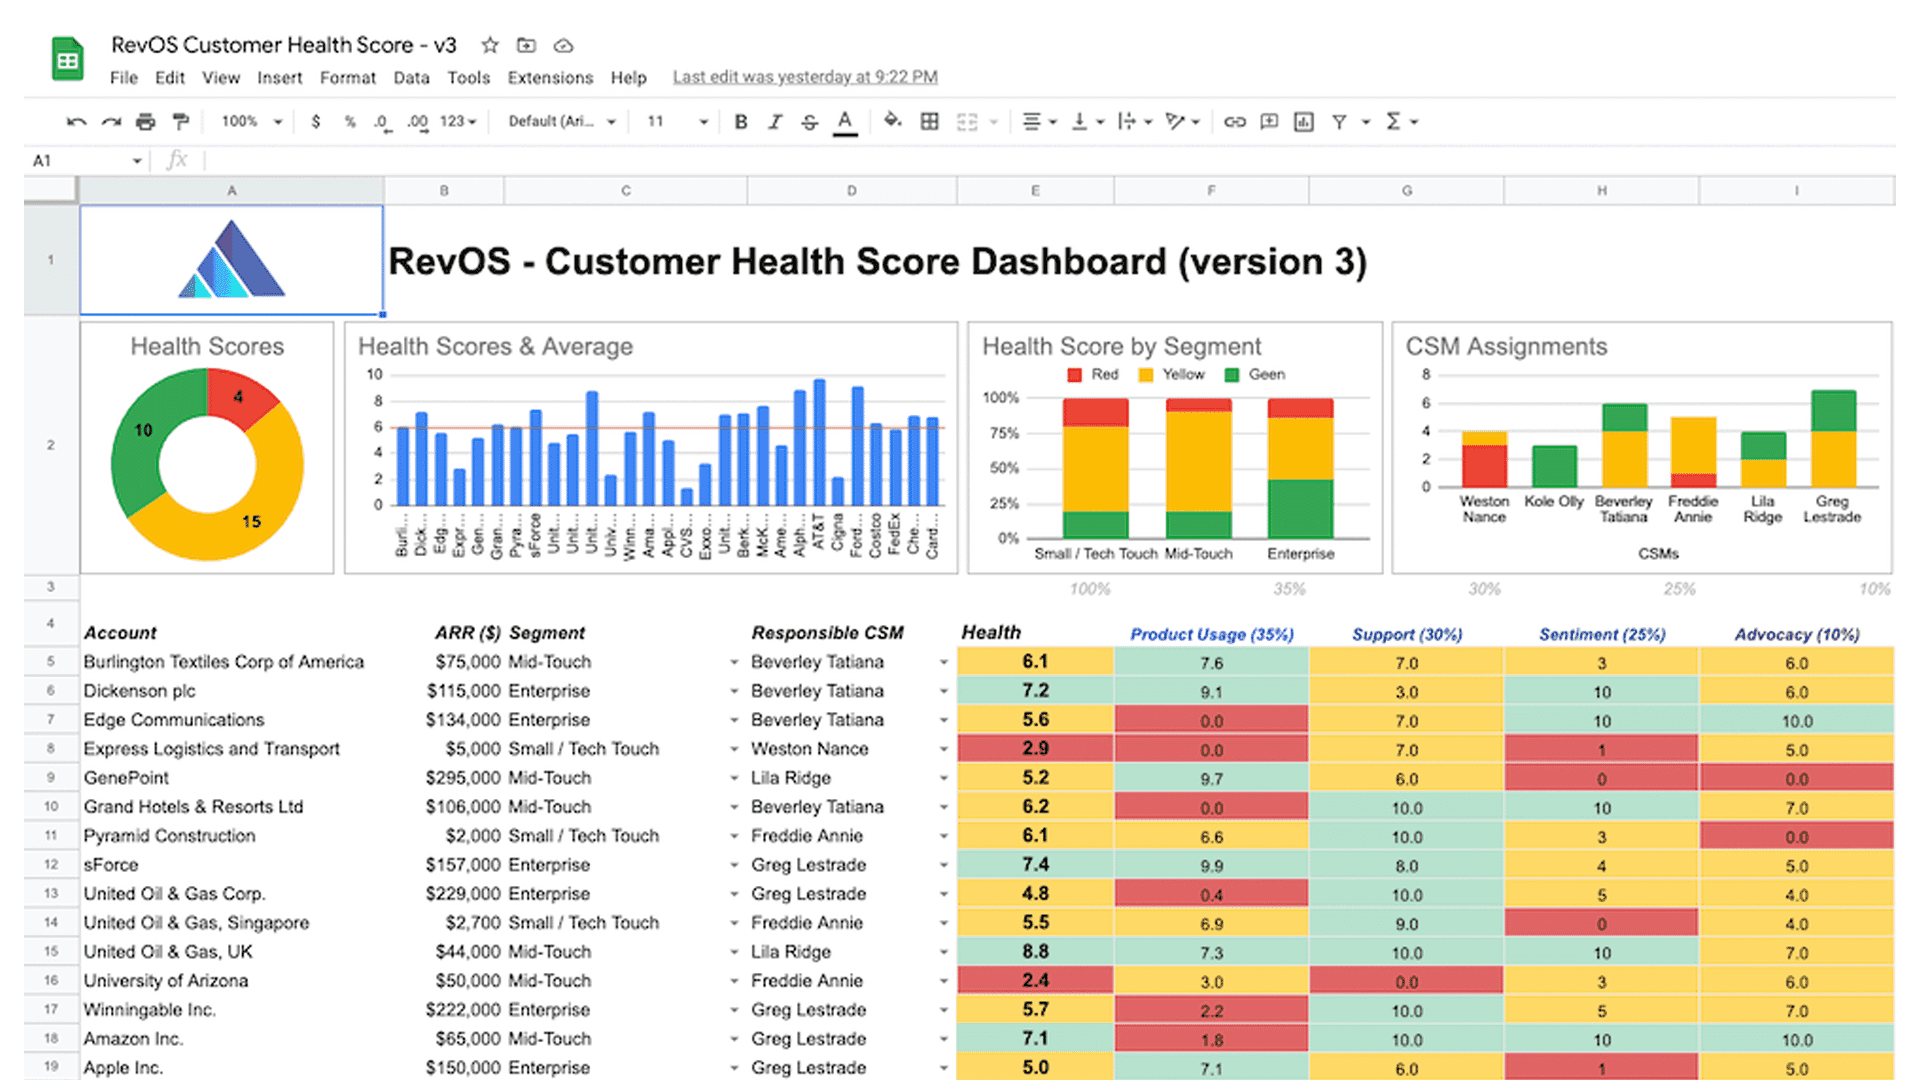
- Inform composite health scoring. Utilization combines with NPS, CSAT, support load, and value realization into a single account-level health number — utilization is usually the most reliable leading signal in that composite. Our 2025 Customer Health Score template update shows how these signals are weighted together in practice.
- Allocate CS time intelligently. Pull the bottom-quartile-utilization accounts into a structured outreach motion (training, QBR, executive briefing) rather than fire-fighting whoever escalates loudest.
- Inform product investment. If utilization is structurally low across an entire customer segment, the product, not the customers, is the problem.
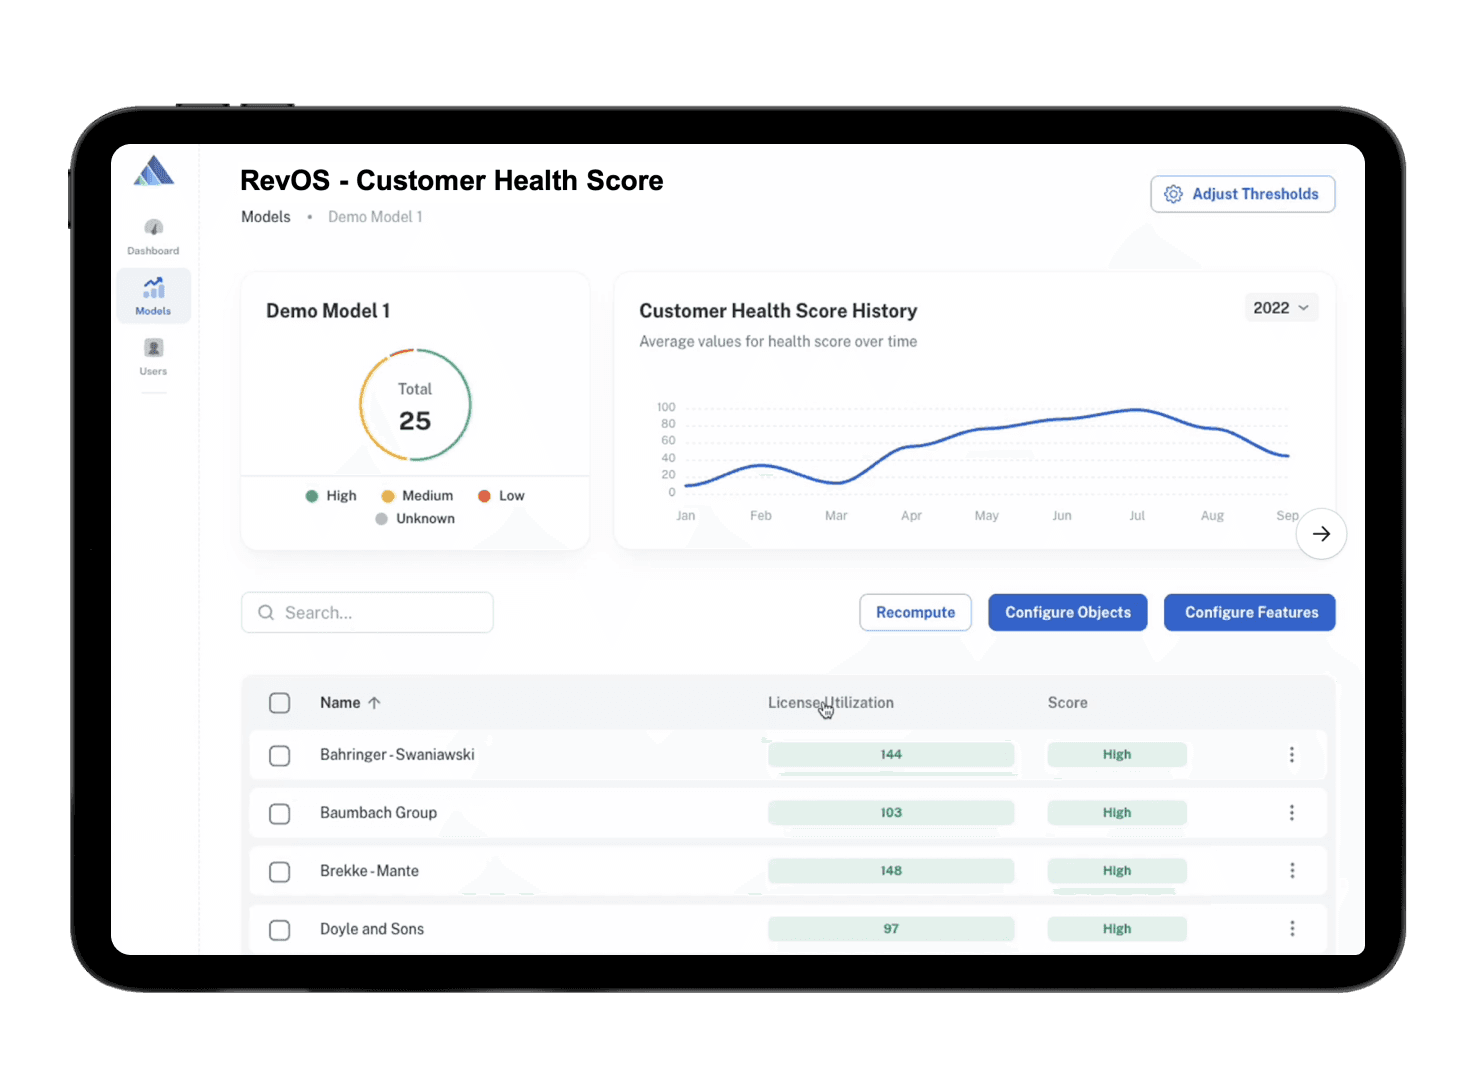
With the RevOS platform, you can track license utilization and the rest of the customer health stack across all your accounts, set predictive alarms on utilization drops, and never miss a critical customer event.
Ready to take your customer success to the next level? Try RevOS today and turn license utilization into a reliable churn early warning.
License utilization and renewals#
In renewal negotiations, license utilization is the single most important number on the table. The conversation pattern:
- Utilization >85% with monthly user growth — open with seat expansion, not renewal. The account is in upsell territory.
- Utilization 60–85%, stable — straightforward renewal. Show the utilization trend chart in the QBR; the customer's own data is the strongest renewal argument.
- Utilization 50–60%, stable or declining — the renewal is at risk. Schedule a value-realization session 60+ days out. Identify which roles or teams aren't activated and build a re-onboarding plan.
- Utilization <50% — assume churn unless proven otherwise. Get the executive sponsor involved early. A seat reduction at renewal is often the best outcome — better to renew 50 seats at high utilization than lose 100 seats entirely.
Challenges in measuring license utilization#
Implementing license utilization tracking presents several real challenges:
- Data accuracy. Collecting and tracking accurate usage data requires instrumented login / event tracking that's tied to license records. Many companies have the login data and the seat count, but not joined.
- Complex licensing models. Unlimited-seat contracts, concurrent-user models, and SKU-based pricing all need bespoke utilization definitions. Pick one definition per contract type and stay consistent.
- Role-weighted usage. A monthly active admin is more valuable than a monthly active read-only viewer. Mature programs apply role weights to the "Active Users" numerator.
- Seasonality. Some products are used seasonally (year-end close, quarterly reporting, tax season). Don't trigger churn alarms on August utilization for a year-end product — rolling 12-month or peak-month baselines are more honest.
- Compliance overlap. Customers can be over-utilizing (more named users than purchased seats) or under-utilizing the same contract. Both matter, but for different conversations — over-utilization is a billing conversation, under-utilization is a retention conversation.
License utilization vs adoption — what's the difference?#
License utilization is a seat-level ratio: how many of the seats you paid for are being used. Adoption is a depth-of-use measure: of the users who are active, how many use the core features the product is meant to deliver.
A customer can have high utilization, low adoption — every seat logs in monthly, but nobody uses the workflow automation features. That's a strong renewal but a weak expansion candidate. A customer can also have low utilization, high adoption — only 30% of seats are active, but those 30% are deeply integrated. That's a contract-right-sizing conversation, not a churn risk.
Healthy customer health scoring tracks both. Utilization tells you who's at risk of leaving; adoption tells you who's at risk of plateauing.
Build your customer health score#
License utilization is one signal — usually a leading one — in a broader composite customer health score that surfaces at-risk accounts before they churn. See the Customer Health Score guide for the full framework: how to weigh license utilization against NPS, CSAT, support load, and value realization in a single score.
FAQ#
What is license utilization?#
License utilization is the percentage of purchased SaaS seats that are actively being used. It is calculated as (Active Users ÷ Licensed Seats) × 100 and is one of the most predictive leading indicators of customer churn and expansion potential.
How do you calculate license utilization?#
Use the formula (Active Users ÷ Licensed Seats) × 100. "Active Users" means users who logged in or performed a meaningful action inside a chosen window (monthly is the most common). "Licensed Seats" is the number of paid seats on the contract. Example: 62 active users on a 100-seat plan = 62% license utilization.
What is a healthy license utilization rate?#
For mature B2B SaaS the healthy range is 60–85%. Below 50% signals likely churn risk; above 90% signals expansion opportunity. The healthy range varies by product category — collaboration tools should sit at 70–90%, specialist BI or developer tools at 50–75%, and enterprise IT platforms at 40–70%.
Why does license utilization matter for customer health?#
License utilization moves 30–60 days before satisfaction metrics (NPS, CSAT) and 60–90 days before renewal conversations. That lead time is what makes it one of the most actionable signals in a composite customer health score — by the time NPS reflects dissatisfaction, the renewal is often already lost. Utilization catches the problem early enough to intervene.
How does license utilization affect renewals and expansion?#
Above 85% with user growth is an upsell signal — open the renewal as an expansion conversation. 60–85% stable is a straightforward renewal. 50–60% declining flags renewal risk and triggers a value-realization session 60+ days out. Below 50% should be assumed to be churn unless proven otherwise, and the right outcome is often a seat reduction at renewal rather than losing the account entirely.
What's the difference between license utilization and adoption?#
License utilization is a seat-level ratio (how many seats are active). Adoption is depth-of-use (which features the active users actually use). A customer can have high utilization but low adoption — every seat logs in, but nobody uses the core features. Track both: utilization predicts churn, adoption predicts expansion ceiling.
What tools can track license utilization?#
For internal SaaS spend management, Flexera, Zylo, Apptio, CloudFuze, and Spendflo track utilization across your purchased SaaS stack. For vendor-side customer health (tracking how your customers use your SaaS), use a customer health platform — RevOS joins utilization with NPS, CSAT, support load, and value-realization signals into a single account-level score.
Related customer health metrics#
- Net Promoter Score (NPS)
- Customer Satisfaction Score (CSAT)
- DAU / MAU ratio
- WAU / MAU ratio
- Customer Effort Score (CES)
- First Contact Resolution (FCR)
- Time to Full Resolution (TFR)
- Time to First Reply (TFR)
Frequently asked questions
- What is license utilization?
- License utilization is the percentage of purchased SaaS seats that are actively being used. It is calculated as (Active Users ÷ Licensed Seats) × 100 and is one of the most predictive leading indicators of customer churn and expansion potential.
- How do you calculate license utilization?
- Use the formula (Active Users ÷ Licensed Seats) × 100 . "Active Users" means users who logged in or performed a meaningful action inside a chosen window (monthly is the most common). "Licensed Seats" is the number of paid seats on the contract. Example: 62 active users on a 100-seat plan = 62% license utilization.
- What is a healthy license utilization rate?
- For mature B2B SaaS the healthy range is 60–85% . Below 50% signals likely churn risk; above 90% signals expansion opportunity. The healthy range varies by product category — collaboration tools should sit at 70–90%, specialist BI or developer tools at 50–75%, and enterprise IT platforms at 40–70%.
- Why does license utilization matter for customer health?
- License utilization moves 30–60 days before satisfaction metrics (NPS, CSAT) and 60–90 days before renewal conversations. That lead time is what makes it one of the most actionable signals in a composite customer health score — by the time NPS reflects dissatisfaction, the renewal is often already lost. Utilization catches the problem early enough to intervene.
- How does license utilization affect renewals and expansion?
- Above 85% with user growth is an upsell signal — open the renewal as an expansion conversation. 60–85% stable is a straightforward renewal. 50–60% declining flags renewal risk and triggers a value-realization session 60+ days out. Below 50% should be assumed to be churn unless proven otherwise, and the right outcome is often a seat reduction at renewal rather than losing the account entirely.
- What's the difference between license utilization and adoption?
- License utilization is a seat-level ratio (how many seats are active). Adoption is depth-of-use (which features the active users actually use). A customer can have high utilization but low adoption — every seat logs in, but nobody uses the core features. Track both: utilization predicts churn, adoption predicts expansion ceiling.
- What tools can track license utilization?
- For internal SaaS spend management, Flexera, Zylo, Apptio, CloudFuze, and Spendflo track utilization across your purchased SaaS stack. For vendor -side customer health (tracking how your customers use your SaaS), use a customer health platform — RevOS joins utilization with NPS, CSAT, support load, and value-realization signals into a single account-level score.
Read more about revenue operations, growth strategies, and metrics in our blog and follow us on LinkedIn and Youtube.
All articles