

On this page
- How to calculate CES
- The 1–7 "made it easy" scale (and why it replaced the old 1–5 "effort" scale)
- 2026 CES benchmarks by industry
- CES vs NPS vs CSAT — at a glance
- Challenges with CES
- CES alternatives (and complements)
- CES survey best practices
- FAQ
- Build your customer health score
- Related customer health metrics
Customer Effort Score (CES) is a single-question customer-experience metric calculated as (Sum of ratings ÷ Number of responses), where customers rate the statement "[Company] made it easy for me to handle my issue" on a 1–7 scale (1 = Strongly Disagree, 7 = Strongly Agree). A healthy CES sits at ≥5.0 average or 70%+ Top-2 Box (responses of 6 or 7); below 4.0 average signals serious friction. CES is one of three customer-experience metrics — paired with CSAT (satisfaction) and NPS (loyalty), it forms the front-line effort signal in any composite customer health score.
CES is asked immediately after a specific interaction — a support ticket resolution, a checkout, an onboarding step, a feature use — not as an annual relationship survey. That's what makes it different from CSAT (which can be transactional or relational) and NPS (which is almost always relational). Use CES when you want to find friction inside a workflow; use CSAT for overall satisfaction; use NPS for long-term loyalty.
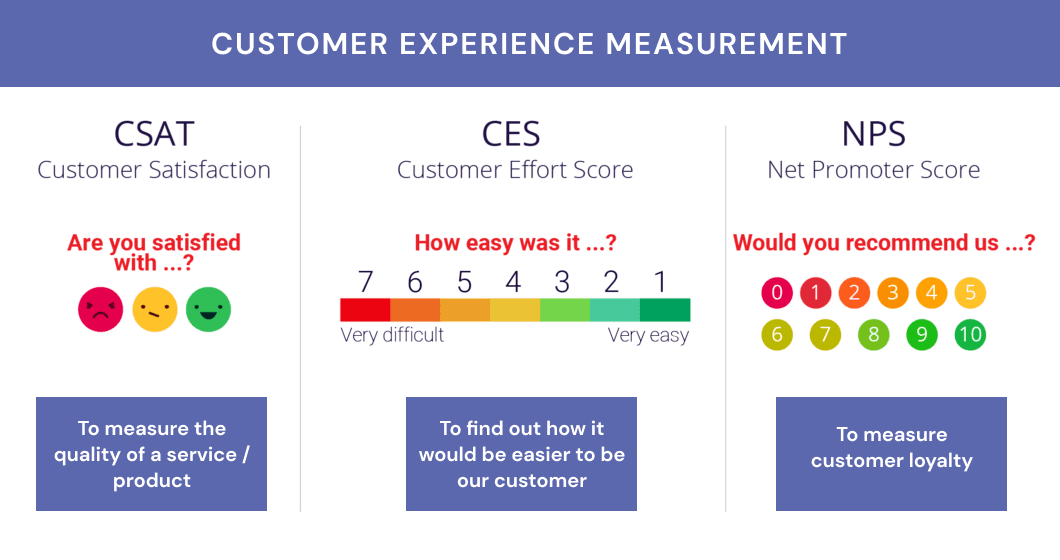
Pic.1 Customer Experience Measurement: Customer Satisfaction — Customer Effort Score — Net Promoter Score
How to calculate CES#
Three calculation methods are in industry use as of 2026:
- Average score — sum every numerical response (1 through 7), divide by the number of respondents. Simplest method; reports a single number on the scale.
- Top-2 Box (% Easy) — the percentage of respondents who answered 6 or 7. Preferred for internal reporting because it cleanly distinguishes "easy" from "merely OK." This is the Qualtrics + Gartner convention.
- Top-3 Box — percentage answering 5, 6, or 7. More forgiving; useful when sample sizes are small.
Example. 500 customers respond to your CES survey after a support interaction. Their answers sum to 3,000. Average CES = 3,000 ÷ 500 = 6.0 — strong. If 380 of those 500 answered 6 or 7, your Top-2 Box = 380 ÷ 500 = 76% — also strong.
Most B2B SaaS teams report both: the average for trend tracking, the Top-2 Box for board decks and renewal forecasting.
The 1–7 "made it easy" scale (and why it replaced the old 1–5 "effort" scale)#
The original CES, introduced by CEB (Corporate Executive Board, now Gartner) in 2010, used a 1–5 scale where customers rated how much effort they had to put in — lower was better. The 2013 revision (CES 2.0) flipped the framing: the question became "[Company] made it easy for me to handle my issue," on a 1–7 agreement scale where higher is better. That's the version Qualtrics, IBM, SurveyMonkey, Zendesk, and Gartner all use today.
If you see older articles describing CES as "lower is better," they're referencing the deprecated 1–5 scale. Use the 1–7 "made it easy" scale in any new survey.
Example question wordings that are aligned with the 1–7 standard:
- "[Company] made it easy for me to handle my issue."
- "How easy was it to use [Product] today?"
- "To what extent do you agree: the company made it easy for me to resolve my problem?"
2026 CES benchmarks by industry#
Concrete benchmarks for the 1–7 scale, drawn from Qualtrics CX benchmarks, Zendesk 2026 CX Trends, and Balto's 2025 CES guide:
| Industry | 2026 CES benchmark (1–7 average) | Top-2 Box (% rating 6 or 7) |
|---|---|---|
| B2B SaaS | 5.4–6.0 | 65–78% |
| E-commerce / retail | 5.6–6.2 | 70–82% |
| Financial services | 5.2–5.8 | 60–72% |
| Telecom / utilities | 4.8–5.4 | 50–65% |
| Cross-industry "good" floor | ≥5.0 | ≥65% |
B2B SaaS reading: aim for a 5.5+ average and 70%+ Top-2 Box. Anything under 5.0 is a churn warning signal — pair it with NPS detractor density and license-utilization decline to identify the at-risk accounts.
Industry benchmarks are reference points, not targets. The more useful baseline is your own CES from 90 days ago — track the trend, not the absolute number.
CES vs NPS vs CSAT — at a glance#
| Metric | What it measures | Scale | When to ask | Best for |
|---|---|---|---|---|
| CES | Effort / friction on a specific task | 1–7 ("made it easy") | Right after a task (ticket close, checkout, onboarding step) | Finding friction inside a workflow |
| CSAT | Satisfaction with a specific interaction or product overall | 1–5 ("very dissatisfied" → "very satisfied"), % positive (4 or 5) | After interaction or quarterly | Front-line CX scoring |
| NPS | Long-term loyalty / willingness to recommend | 0–10, net of % promoters minus % detractors | Quarterly / annually | Brand and renewal risk |
All three are inputs into a composite customer health score. None of them is sufficient alone — CES tells you whether the last interaction was smooth, but says nothing about long-term retention; NPS tells you who would recommend you, but says nothing about whether your checkout is broken; CSAT averages over both.
Challenges with CES#
CES is the cheapest CX metric to deploy and one of the easiest to misread. The usual failure modes:
- Sampling bias. Customers who had a great or a terrible experience are more likely to respond than the middle. Use forced-prompt surveys (in-product modals, post-resolution emails to every ticket-closer) to keep the sample representative.
- Survey fatigue. If you ask CES after every interaction, response rates collapse. Sample — for example, after 1 in 5 ticket closures or 1 in 10 logins.
- Channel-level noise. A customer who calls in with a complex enterprise integration issue will report a higher effort score than someone who clicked a self-service article. Segment CES by channel (chat, phone, email, in-product, self-service) and by issue complexity before drawing conclusions.
- Root-cause ambiguity. A low CES score doesn't tell you why. Always pair the numeric CES with a one-line follow-up: "What made this hard?" Free-text responses are where the actual fix lives.
- Score gaming. When CES becomes a support-team KPI, agents start nudging customers ("Please rate me a 7"). Audit periodically.
CES alternatives (and complements)#
CES is one of several customer satisfaction and loyalty metrics. They are not substitutes — combine them:
- Net Promoter Score (NPS) — likelihood to recommend, 0–10 scale, net of promoters minus detractors. Best for long-term loyalty signal. See our NPS guide.
- Customer Satisfaction Score (CSAT) — satisfaction with a specific product, service, or interaction, 1-5 scale, % positive. See our CSAT guide.
- First Contact Resolution (FCR) — percentage of issues resolved on the initial contact. Operational metric, but a strong leading indicator of CES. See our FCR guide.
- Time to Full Resolution (TFR) — average time from issue raised to issue fully closed. Pairs with CES to distinguish fast & easy from slow but easy. See our TFR guide.
- Repeat Purchase Rate (RPR) — behavioral loyalty signal that converts attitudinal scores like CES into commercial outcomes.
Used together, these provide a much more complete picture of customer experience than any single number.
CES survey best practices#
- Ask one CES question. Adding more turns it into a generic CX survey and tanks response rates.
- Ask right after the interaction — within minutes for in-product or chat; within 24 hours for ticket close.
- Always include a free-text "What made this hard?" follow-up for any rating ≤ 4.
- Sample, don't blanket-survey.
- Report both the average and the Top-2 Box — they tell different stories.
- Segment by channel, issue type, and customer tier before drawing conclusions.
FAQ#
What is customer effort score?#
Customer Effort Score (CES) is a single-question customer-experience metric that measures how much effort a customer had to exert to complete a task — resolve an issue, make a purchase, get an answer, complete an onboarding step. Customers rate the statement "[Company] made it easy for me to handle my issue" on a 1–7 scale where 1 is Strongly Disagree and 7 is Strongly Agree. It's a leading indicator of churn: high-effort experiences are one of the strongest predictors of disloyalty.
How do you calculate CES (customer effort score)?#
There are three standard methods. The simplest is the average: sum every numerical response and divide by the number of respondents — CES = (Sum of ratings ÷ Number of responses). Most teams also report the Top-2 Box percentage: the share of respondents who answered 6 or 7 (the "easy" responses). Top-3 Box (5, 6, or 7) is used when sample sizes are small. Example: 500 responses summing to 3,000 → average CES = 6.0; if 380 of those answered 6 or 7, Top-2 Box = 76%.
What is a good customer effort score?#
On the 1–7 "made it easy" scale, a healthy CES is ≥5.0 average or 70%+ Top-2 Box. Below 4.0 average is a serious friction warning. By industry: B2B SaaS targets 5.4–6.0 average; e-commerce 5.6–6.2; financial services 5.2–5.8; telecom/utilities 4.8–5.4. Your own 90-day trend matters more than the absolute number — track whether it's moving up or down.
Customer effort score vs NPS vs CSAT — what's the difference?#
CES measures effort on a specific task (1–7, "made it easy"), asked right after the interaction. CSAT measures satisfaction with a specific interaction or product (1–5, "very dissatisfied" → "very satisfied"), reported as % positive (4 or 5). NPS measures long-term loyalty (0–10, likelihood to recommend), reported as % promoters minus % detractors. CES is best for finding friction inside workflows; CSAT for front-line CX; NPS for renewal and brand risk. Combine all three in a composite customer health score — none is sufficient alone.
When should I use CES?#
Use CES immediately after a specific interaction where you want to know whether the customer found the experience easy: support ticket resolution, checkout, onboarding step completion, feature use, billing change. Do not use CES as an annual relationship survey — that's NPS territory. The signal degrades fast: ask within minutes for in-product or chat, within 24 hours for ticket close.
What are CES survey best practices?#
Ask only one question. Send it within 24 hours of the interaction. Include a free-text "What made this hard?" follow-up for any rating of 4 or lower. Sample interactions (e.g., 1 in 5 ticket closures) rather than blanket-surveying — survey fatigue tanks response rates. Report both the average and the Top-2 Box percentage. Segment results by channel, issue type, and customer tier before drawing conclusions. Audit periodically for score gaming if CES is tied to agent compensation.
Is a lower CES score better or worse?#
On the modern 1–7 "made it easy" scale used by Qualtrics, IBM, SurveyMonkey, and Gartner, higher is better — 7 means the customer strongly agreed the company made it easy. The confusion comes from the original 2010 CEB scale, which asked customers to rate "how much effort" they had to put in on 1–5, where lower was better. That scale was deprecated in 2013 in favor of the current 1–7 agreement scale. If you encounter "lower is better" CES guidance, it's referencing the old scale — use the 1–7 version for any new survey.
Build your customer health score#
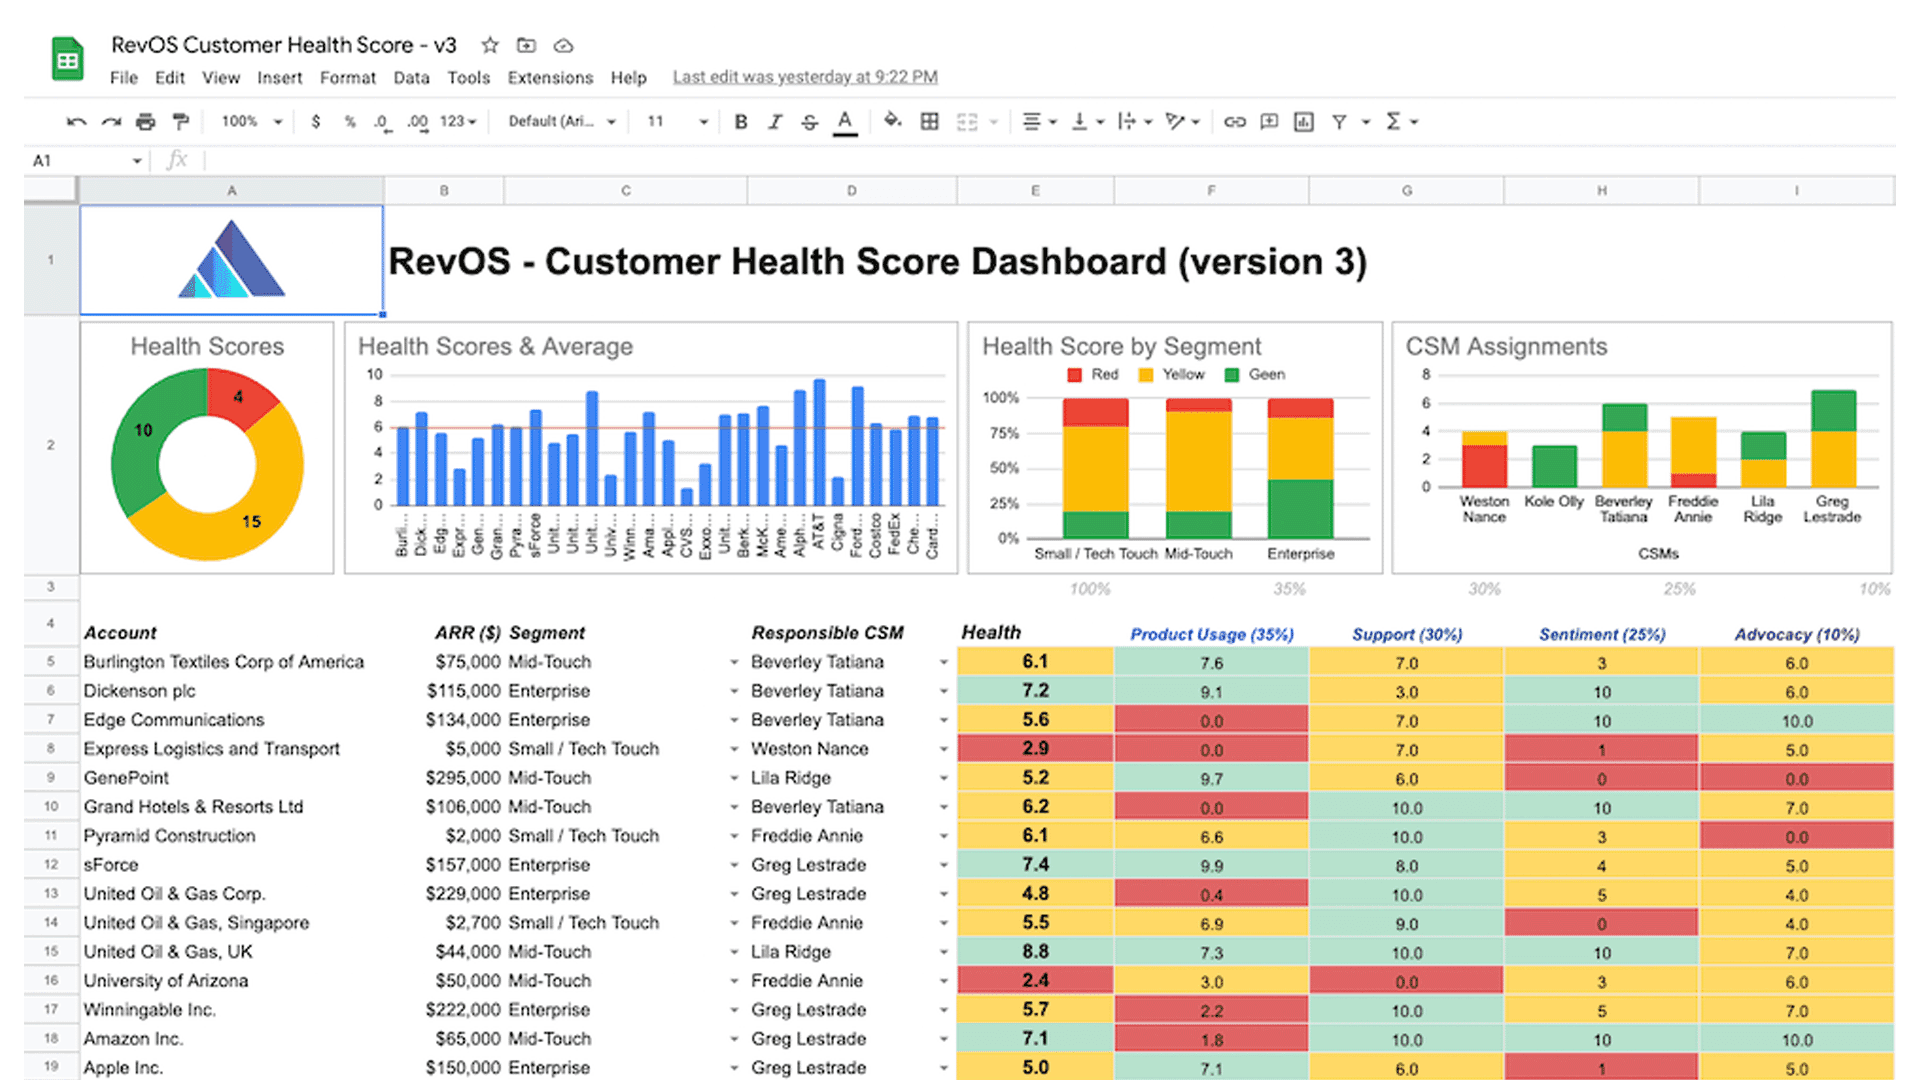
CES is most useful as part of a composite customer health score — alongside NPS, CSAT, product adoption, and support load. That composite is the metric you should actually be driving renewal and expansion decisions on. See the Customer Health Score guide for the full framework: how to weigh each signal, how to set thresholds, and how the metrics on this blog fit together.
Related customer health metrics#
- Net Promoter Score (NPS)
- Customer Satisfaction Score (CSAT)
- License Utilization
- First Contact Resolution (FCR)
- Time to Full Resolution (TFR)
- Time to First Reply
- DAU / MAU ratio
- WAU / MAU ratio
Frequently asked questions
- What is customer effort score?
- Customer Effort Score (CES) is a single-question customer-experience metric that measures how much effort a customer had to exert to complete a task — resolve an issue, make a purchase, get an answer, complete an onboarding step. Customers rate the statement "[Company] made it easy for me to handle my issue" on a 1–7 scale where 1 is Strongly Disagree and 7 is Strongly Agree. It's a leading indicator of churn: high-effort experiences are one of the strongest predictors of disloyalty.
- How do you calculate CES (customer effort score)?
- There are three standard methods. The simplest is the average : sum every numerical response and divide by the number of respondents — CES = (Sum of ratings ÷ Number of responses) . Most teams also report the Top-2 Box percentage: the share of respondents who answered 6 or 7 (the "easy" responses). Top-3 Box (5, 6, or 7) is used when sample sizes are small. Example: 500 responses summing to 3,000 → average CES = 6.0; if 380 of those answered 6 or 7, Top-2 Box = 76%.
- What is a good customer effort score?
- On the 1–7 "made it easy" scale, a healthy CES is ≥5.0 average or 70%+ Top-2 Box . Below 4.0 average is a serious friction warning. By industry: B2B SaaS targets 5.4–6.0 average; e-commerce 5.6–6.2; financial services 5.2–5.8; telecom/utilities 4.8–5.4. Your own 90-day trend matters more than the absolute number — track whether it's moving up or down.
- Customer effort score vs NPS vs CSAT — what's the difference?
- CES measures effort on a specific task (1–7, "made it easy"), asked right after the interaction. CSAT measures satisfaction with a specific interaction or product (1–5, "very dissatisfied" → "very satisfied"), reported as % positive (4 or 5). NPS measures long-term loyalty (0–10, likelihood to recommend), reported as % promoters minus % detractors. CES is best for finding friction inside workflows; CSAT for front-line CX; NPS for renewal and brand risk. Combine all three in a composite customer health score — none is sufficient alone.
- When should I use CES?
- Use CES immediately after a specific interaction where you want to know whether the customer found the experience easy: support ticket resolution, checkout, onboarding step completion, feature use, billing change. Do not use CES as an annual relationship survey — that's NPS territory. The signal degrades fast: ask within minutes for in-product or chat, within 24 hours for ticket close.
- What are CES survey best practices?
- Ask only one question. Send it within 24 hours of the interaction. Include a free-text "What made this hard?" follow-up for any rating of 4 or lower. Sample interactions (e.g., 1 in 5 ticket closures) rather than blanket-surveying — survey fatigue tanks response rates. Report both the average and the Top-2 Box percentage. Segment results by channel, issue type, and customer tier before drawing conclusions. Audit periodically for score gaming if CES is tied to agent compensation.
- Is a lower CES score better or worse?
- On the modern 1–7 "made it easy" scale used by Qualtrics, IBM, SurveyMonkey, and Gartner, higher is better — 7 means the customer strongly agreed the company made it easy. The confusion comes from the original 2010 CEB scale, which asked customers to rate "how much effort" they had to put in on 1–5, where lower was better. That scale was deprecated in 2013 in favor of the current 1–7 agreement scale. If you encounter "lower is better" CES guidance, it's referencing the old scale — use the 1–7 version for any new survey.
Read more about revenue operations, growth strategies, and metrics in our blog and follow us on LinkedIn and Youtube.
All articles