

On this page
- What is a Customer Health Score?
- Why is Customer Health Score so important?
- How to calculate Customer Health Score?
- What's a good customer health score?
- Customer Health Score Examples
- Customer Health Score Metrics
- Why a "green" health score can still miss churn
- How customer health scoring is changing in 2026
- Build your customer health score
What is a Customer Health Score?#
A customer health score is a composite metric that combines product usage, engagement, support, and sentiment signals into a single number — usually on a 0–100 scale — that predicts how likely a customer is to renew, expand, or churn. Customer success and account management teams use it to prioritise outreach before revenue is at risk, instead of reacting once a customer has already decided to leave.
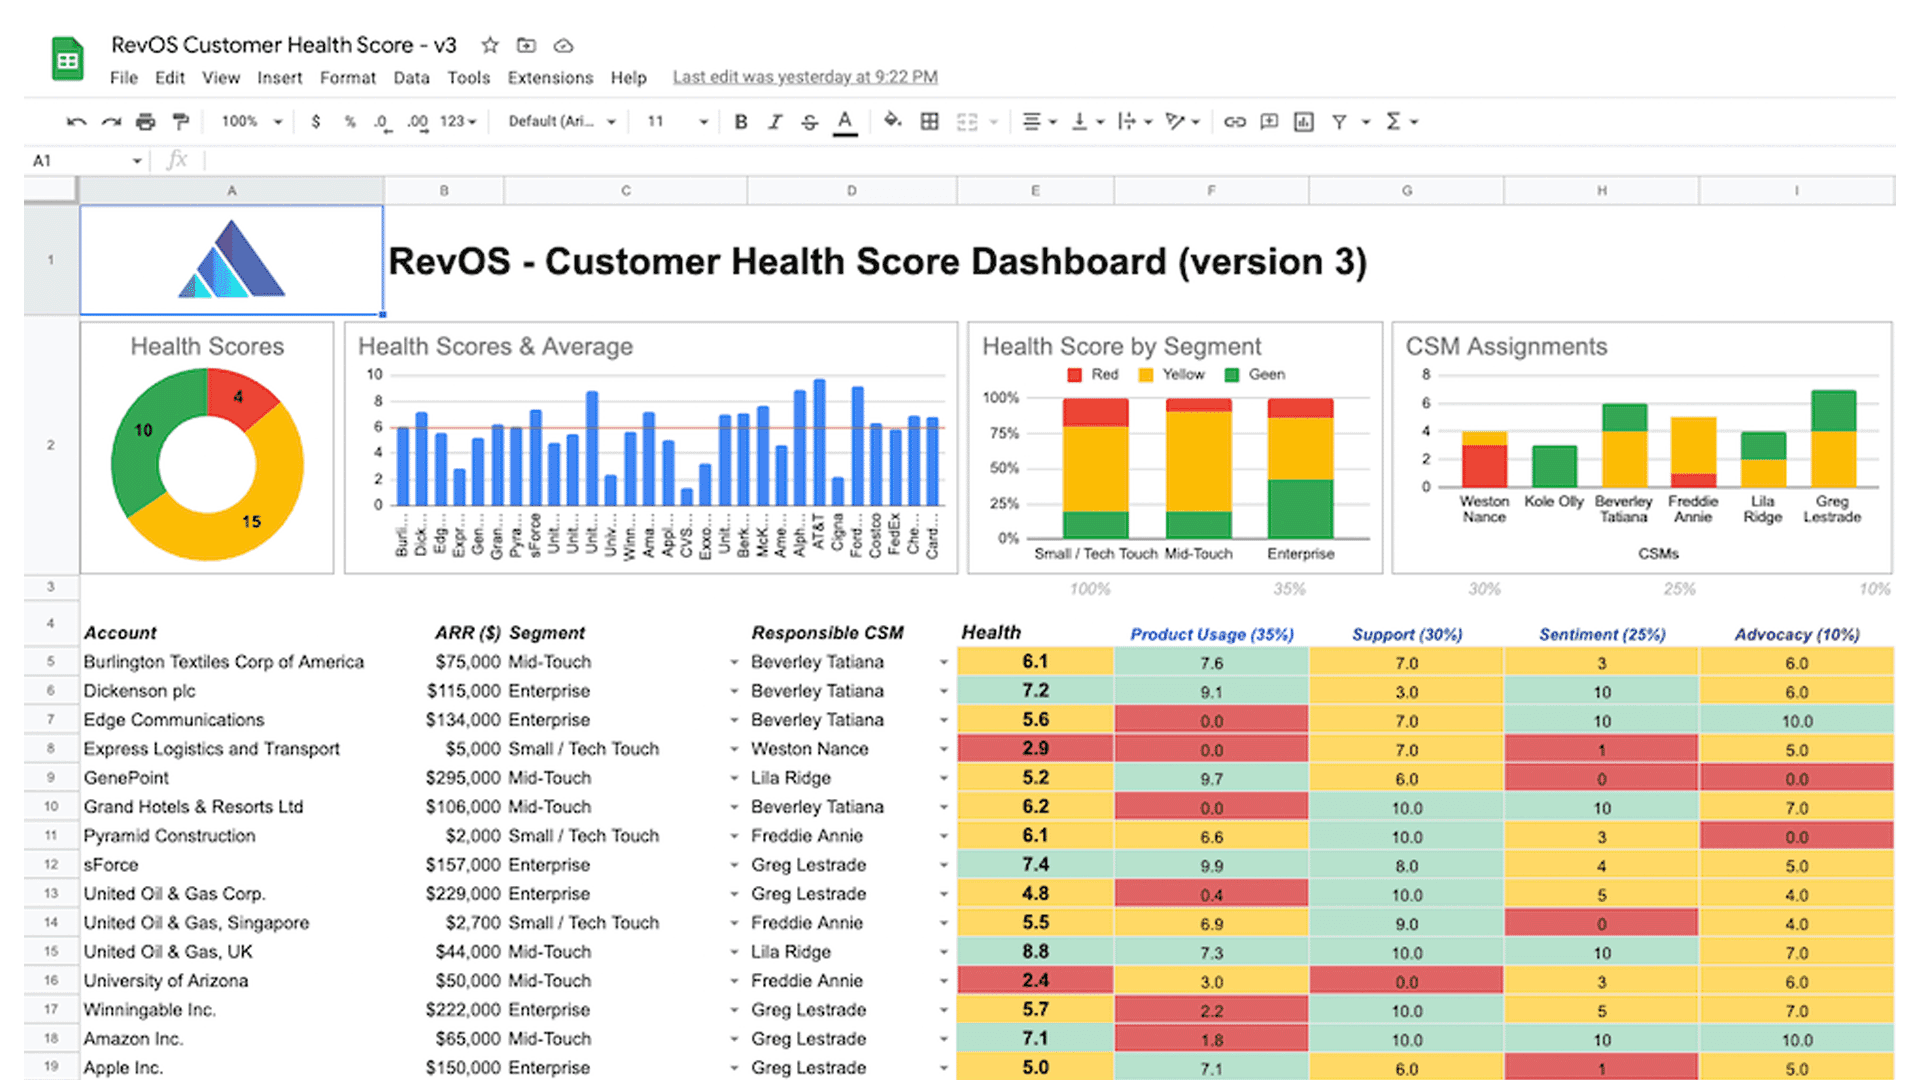
It works as an early-warning system: healthy customers are likely to stay and grow, while a declining score flags an at-risk account in time to act. At RevOS we pressure-tested the drivers and weights below against 30M+ customer data points and packaged the result into a free Customer Health Score template you can copy.
Why is Customer Health Score so important?#
The customer health score allows you to stay informed about customer relationships. Healthy customers are more likely to remain with your business, while unhealthy customers are at risk of leaving. As soon as you start tracking this metric, you will be able to make data driven decisions and react proactively.
The financial case for getting ahead of churn is well established. As Harvard Business Review summarises Bain & Company's research, acquiring a new customer can cost five to 25 times more than retaining an existing one, and increasing customer retention by just 5% can increase profits by 25% to 95%. A customer health score is the early-warning system that makes that retention possible — it surfaces at-risk accounts while there is still time to act. As a result you will get the following benefits:
- Reduced churn - satisfied customers are less likely to churn.
- Upsell / Cross-sell opportunities - it’s easier to sell more products and services to happy customers.
- Word-of-mouth - healthy customers are highly likely to promote your product within their network of contacts.
Together, retention and expansion roll up into net revenue retention (NRR) — the metric a health score ultimately moves. For a benchmark, the median private SaaS company reports NRR of around 101%, while best-in-class companies reach 115–125% (2024 KeyBanc Capital Markets & Sapphire Ventures SaaS Survey).
How to calculate Customer Health Score?#
There is no common formula for this type of metric, as exact numbers will depend on your product. However there are some common steps that will guide you through the creation of a best customer health score for you.
- Select your metrics - consider which leading indicators map to your product. Common starting picks: engagement signals like DAU/MAU, satisfaction signals like NPS and CSAT, and support signals like first contact resolution. We expand on each later in this post.
- Establish score distribution - you need to determine the values that indicate if a metric is good or bad. For instance, a WAU / MAU ratio above 0.5 is considered good, while a ratio below 0.3 is considered bad.
- Assign each metric a weight - Consider how a metric affects the overall customer health, as certain metrics may carry more importance than others.
- Segment your customers - your health score model will be simpler if you focus on well-defined customer segments. For example, customers on the 'smaller' pricing plan, by definition, may not have access to particular product features, so measuring product adoption should differentiate by available product features.
- Keep the customer lifecycle in mind - the customer health score indicator may be very subjective to the current customer lifecycle. At each stage of a customer journey like proof of concept, onboarding, training, production usage, and advocacy you should carefully consider what is the success KPIs and leading indicators.
- Try to keep the health score credible and actionable. The fact that the health score is 'red' or 'yellow' should generate management attention, however, it should also be obvious what improvements needed to be made to improve the score.
- Review your health score rules regularly. For example, at the end of each quarter just analyze which customers with a 'green' score churned (false positives) and which customers with a 'red' score renewed / expanded (false negative). Health scoring is not a one-time exercise but a process. Iterating and adjusting regularly will improve your prediction accuracy and understanding of factors influencing customer health.
- Last but not least - automate it! Collecting data and calculating the health score is something you could do with a simple spreadsheet, however, spending CSM's precious time on that is not only economically inefficient but also lead to lower job satisfaction and higher fluctuation. Moreover, you should maintain and update your health score on a regular interval, so spending time in automation and using a dedicated scoring technology will significantly simplify this process and reduce maintenance overhead.
Customer health score formula: a worked example#
Once you've picked your signals and weights, the calculation itself is a weighted average. Score each signal from 0–100, multiply by its weight, and add the results into a single composite score:
| Signal category | Example metric | Weight | Account score (0–100) | Weighted score |
|---|---|---|---|---|
| Product adoption | DAU/MAU ratio | 30% | 70 | 21.0 |
| Satisfaction | NPS | 25% | 60 | 15.0 |
| Support experience | First contact resolution | 20% | 80 | 16.0 |
| Engagement | License utilization | 15% | 50 | 7.5 |
| Relationship | Active executive sponsor | 10% | 100 | 10.0 |
| Composite | 100% | 69.5 — at risk |
In this example the account looks fine on support and sponsorship, but weak adoption and middling satisfaction drag the composite down to 69.5, landing it in the "at risk" band below. That's the cue for a CSM to step in well before renewal.
What's a good customer health score?#
There's no universal number — the bands depend on your weights and segments — but most teams group accounts into three tiers and act on each differently:
- Healthy (71–100): on track to renew and expand. Target for upsell, advocacy, and case studies.
- At risk (31–70): mixed signals. Prioritise proactive outreach and a clear, time-boxed success plan.
- Critical (0–30): likely to churn. Escalate to a save play with the right people involved.
Calibrate the thresholds against your own history: each quarter, check which "green" accounts churned (false positives) and which "red" accounts renewed (false negatives), and adjust the weights accordingly.
Customer Health Score Examples#
Now when you have scored your customers, there are different ways to to represent the results. Here are a few examples.
Percentage Scale#
To calculate this, first you need to find the maximum value for the score and divide customer’s score by this maximum value to get a percentage.
Color Code#
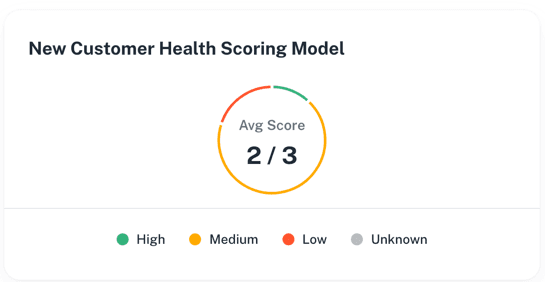
Assigning colors like e.g. green for healthy customers, yellow for medium healthy and red for unhealthy is a simple but powerful method to visualise the scoring results. It helps customer success managers to quickly understand how well a client is doing.
Alphabetical Scale#
Similar to color-coding, an alphabetical scale assigns a letter to each customer based on their customer health score. The higher their score is, the higher the grade.
Customer Health Score Metrics#
We have prepared a comprehensive list of blog posts on different useful metrics that might give you some ideas of what you could use to score you customer’s health:
- Net Promoter Score (NPS)
- Customer Satisfaction Score (CSAT)
- License Utilization
- DAU / MAU ratio
- WAU / MAU ratio
- Customer Effort Score (CES)
- First Contact Resolution (FCR)
- Time to Full Resolution (TFR)
- Time to First Reply (TFR)
Why a "green" health score can still miss churn#
A healthy score is only as good as the signals behind it. In 2026 plenty of customer success teams have watched "green" accounts churn anyway — usage looked fine, the sponsor was engaged, and the account still left. It usually traces back to one of three gaps:
- Stale or self-reported signals. A score built mostly on logins or last quarter's NPS misses a champion who just left or a renewal budget that just got cut.
- One-size-fits-all weights. The drivers that predict churn for an enterprise account rarely match those for SMB — a single model quietly mis-scores both.
- Score without action. A dashboard nobody acts on is theatre. The score has to trigger a specific play, owned by a specific person, with a deadline.
The fix is to feed the score from objective, real-time data across your CRM, product, and support tools — and to revisit the weights regularly rather than setting them once and forgetting them.
How customer health scoring is changing in 2026#
The model behind the health score is shifting. The classic approach — a customer success manager hand-picking metrics and guessing the weights — is giving way to predictive, AI-assisted scoring, because rule-based weights lean on lagging, subjective inputs that flag risk only once it's already late (TSIA, ChurnZero). Three changes are worth folding into your own model:
- From static weights to predictive models. Instead of a CSM assigning weights by intuition, models trained on your historical churn and renewal data learn which signals actually predict outcomes — and they re-learn as your product and customers change.
- From one score to a system of signals. A single number that tries to measure everything predicts almost nothing. The emerging pattern is a set of prioritised signals — each tied to a recommended action — rather than one "Swiss-army" score.
- New signal types that classic scores miss:
- Usage trend, not absolute usage — an account's activity against its own 30- and 90-day rolling average catches the "went from daily to weekly" drift that flat thresholds miss.
- Sentiment from conversations — tone and topics from support tickets, emails, and calls are now a structural input, not a nice-to-have. Gainsight's 2025 research found that health scores incorporating sentiment data delivered 27% lower gross churn than usage-only models.
- Billing signals — changes in billing cadence, such as an annual-to-monthly downgrade, are among the strongest and most under-used leading indicators of churn.
Predictive, AI-driven scoring is still the exception rather than the rule, which makes it a genuine edge for teams that adopt it early. This is exactly the gap RevOS is built to close: it assembles these signals — product usage trends, CRM and support data, sentiment — into a single live score, and recommends the next action instead of leaving a static number on a dashboard.
Build your customer health score#
Building a customer health score from scratch is a substantial project. We've already done the work: assembled the formulas, weighted the signals, and packaged the playbook into a starter spreadsheet. Download our Customer Health Score Template — a free Google Sheets and Excel starter that combines every metric covered above into a single composite score. Prefer not to maintain it in a spreadsheet? RevOS auto-calculates the same signals from your CRM and product data — see the Customer Health Score use case.
Read more about revenue operations, growth strategies, and metrics in our blog and follow us on LinkedIn, Youtube, and Facebook.
All articles