Top 5 Metrics to Predict Customer Churn. Best Practices
 Renat Zubayrov
In our article, we'll go deeper into five specific metrics to Predict Customer Churn. We will highlight the changes in the traditional approach of customer health scoring and how modern companies are actually solving these changes in innovative ways today. Also, you will see the Pros and Contras of each metric.
Why Customer Health Scoring?
Customer health scoring is a very foundation of customer success management because it actually gives a customer success manager and sales a basis for proactive actions to prevent or increase enhancement expansion rather than with accounts or customers who just screaming the loudest. In simple words, it’s state-of-the-art customer success to make sure that we know where to go.
The main advantages to measure health scoring in your company:
- Should show a likelihood of customers growing, staying consistent, or churn.
- Foundation for proactive actions of CSM
- Easy to grasp high-level metrics for Management
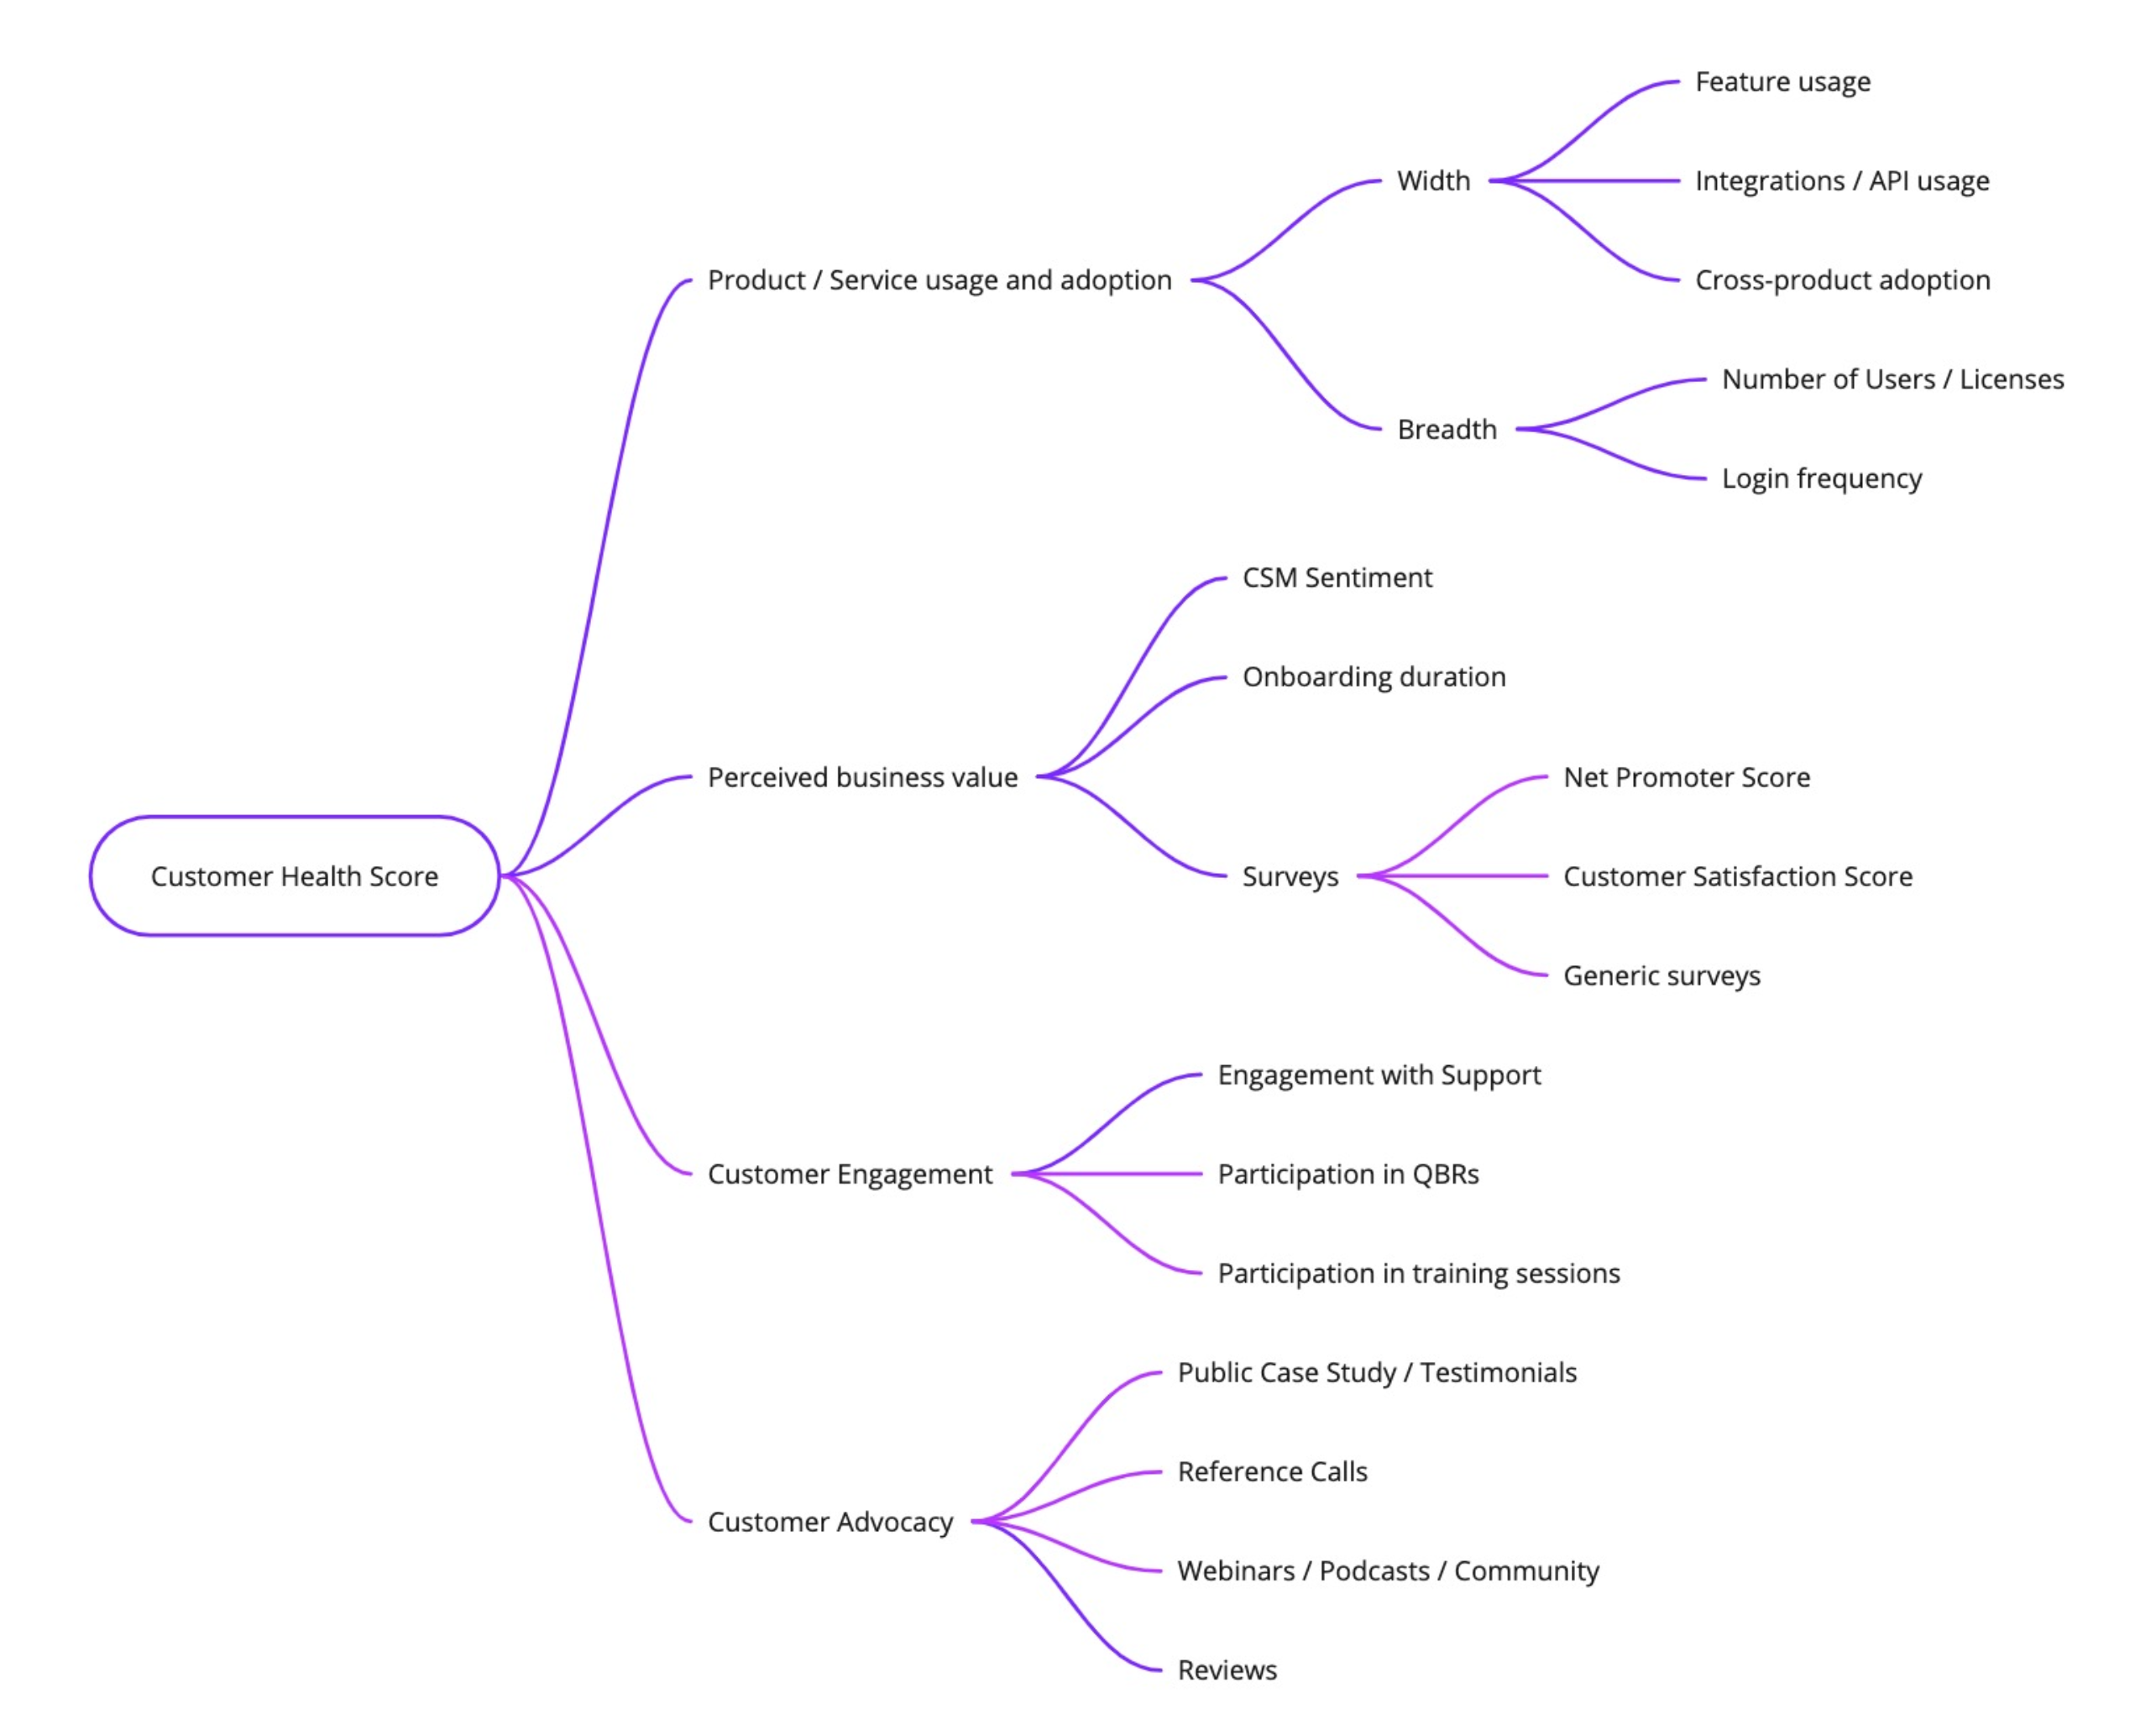
For helping you with metrics we built a Customer Health Score template that you can download from our website. The template includes over 27 different KPIs which could be relevant to understand customer health and predict churn and expansion. But we just picked 5 top metrics which we've seen frequently in many different discussions and engagements and also based on the feedback, what people find useful and what's actually practically used in a bigger part of the health scoring formula.

1. MAU, DAU, WAU
It is one of the most basic user engagement metrics for SaaS / Online tools and is frequently used as a ratio such as DAU/MAU Ratio or WAU/MAU Ratio. Also frequently used as a ratio to the number of licenses/seats.
Pro: Simple, easy to understand; Great tooling support, e.g. in Mixpanel, Pendo, Amplitude etc.
Contra: Not universal (weekly, monthly, quarterly usage; Different roles and scenarios; W1/M1 retention may be treated differently
2. Net Promoter Score®
NPS is a metric used in customer experience programs. It is a survey question asking respondents to rate the likelihood that they would recommend a company, product, or service to a friend or colleague. Originally developed by Bain & Company, a super simple and transparent methodology.
Pro: Simple to understand and easy to do; Build-in in many SaaS tools and universally applicable without any customizations
Contra: Like any survey statistical relevance only with a high number of participants; Not always easy to apply to the 'account' level (e.g. 30% participation rate; High variance in results on non-cohesive groups
3. Activation trigger(s) / TTV
Activation triggers follow the presence and/or frequency of specific events in the customer lifecycle that indicates a generated value of the product. For example, it can be 'aha moments' in your products and services, like for us is preparing a presentation and a video about 5 Top Metrics. This metric is closely related to 'Time to Value', basic & exceeded.
Pro: One of the best predictors of churn and/or expansion; Can be collected automatically (for SaaS) or manually
Contra: Not universal - specific for each application and/or service offering; Tracking can be tricky on the account level where multiple personas are involved
4. Support KPIs
Metrics for support are present by various KPIs and can be used like the Number of Open Tickets, a number of SLA violations, Time to First Reaction, Time to Full Resolution. These indicators are used as absolute values of trends on median values over time.
Pro: Simple to understand and track values; Basic KPIs are supported by major tooling providers like out of the box
Contra: Aggregating on account may lead to lower statistical relevance hence high variance; Health scoring of absolute values might be misleading
CSM Sentiment
Manual assessment of individual Customer Success Managers based on a simple sentiment scale from Very Negative to Very Positive. The de-facto basis for assessment of the quality of any customer health score model.
Pro: Simple, easy to understand; Easy to collect with the required consistency
Contra: Subjective and can be biased; Consistency can be affected by fluctuation in CSM team structure
Challenges with a traditional approach
- Low quality of data or low statistical relevance may affect the relevance of health scoring
- Even simple calculations require complex implementation and integration projects
- Even with a limited number of systems, a number of KPIs can be overwhelming
- Every prediction model requires regular maintenance, which can be complicated when you do it manually
- Machine Learning is a branch of artificial intelligence (AI) and computer science which focuses on the use of data and algorithms to imitate the way that humans learn, gradually improving its accuracy
- Advantages of ML for Customer Health Scoring
- Less tolerant to low data quality and/or missing data
- Adopt and learn over time - capturing data in the time dimension
- Automatically select the most relevant criteria that affect predicted outcome
- Automatically adjust formula (aka. model weights) based on the new data
RevOS.ai is the first no-code AI platform for Sales, Marketing, and Customer Success
- Simple and fast connectivity with connectors to your CRM, DWH, Product, and Support systems
- Pre-defined models for customer, pipeline, and lead scoring. Sales and customer expansion forecasting and many more
- Engagement modules for deploying model predictions right into your CRM
- Automated activity capture to continuously train and improve your model(s)
Video of the webinar Top 5 Metrics to Predict Customer Churn. Best Practices
Read more about revenue operations, growth strategies, and metrics in our blog and follow us on LinkedIn, Youtube, and Facebook.
← Go back to blog