

On this page
The DAU/MAU ratio is the share of monthly active users who also engage with the product on any given day. Calculated as Daily Active Users ÷ Monthly Active Users × 100, it measures product stickiness — what portion of your monthly users come back daily. A ratio above 50% is world-class, typical of social and messaging apps; 20–50% is healthy for most software and B2B SaaS; under 20% is normal for products designed for infrequent use like tax software or travel booking — and that's fine.
How to calculate DAU/MAU?#
This ratio is calculated by dividing the number of unique users who actively engage with a product or service over a day by the number of unique users who actively engage over a month. A higher DAU/MAU ratio indicates that a higher percentage of users are regularly engaging with the product or service, indicating a healthier and more engaged customer base.
What is a good DAU/MAU value?#
A good value for the DAU/MAU metric varies depending on the industry and type of product or service. Generally, a ratio of 0.3 to 0.5 is considered good, indicating that 30-50% of monthly active users are also active on a daily basis. For example, if a company has 1,000 monthly active users, a DAU of 300-500 would be considered good. It is important to keep in mind that different industries and types of products/services may have different benchmarks for what constitutes a good DAU/MAU ratio, and that the ratio should also be considered in the context of overall business goals and metrics.
Challenges#
Measuring and controlling the DAU/MAU ratio can be challenging due to several factors:
- Data Accuracy: Ensuring that the data used to calculate the ratio is accurate and reliable can be a challenge, especially if the data is being collected from multiple sources.
- User Identification: Distinguishing unique users can be difficult, especially if users are accessing the product or service through multiple devices or using anonymous accounts.
- Seasonality: The DAU/MAU ratio can be affected by seasonal fluctuations in user engagement, making it difficult to accurately measure and control the metric.
- Changes in User Behavior: Changes in user behavior, such as new features or product updates, can impact the DAU/MAU ratio and make it difficult to control.
- Interpreting Results: Interpreting the results of the DAU/MAU ratio can be challenging, especially when considering the impact of external factors such as marketing campaigns or industry trends.
To effectively measure and control the DAU/MAU ratio, it is important to have clear definitions and processes for collecting and analyzing data, to regularly monitor the metric and adjust strategies as needed, and to consider the ratio in the context of other relevant business metrics.
Alternatives to DAU/MAU ratio#
There are several alternative metrics that can be used instead of, or in conjunction with, the DAU/MAU ratio to measure customer engagement and feed a composite customer health score:
- WAU/MAU (Weekly Active Users to Monthly Active Users) ratio: Measures the percentage of monthly active users who engage with a product or service on a weekly basis.
- Retention Rate: Measures the percentage of users who return to a product or service over a specific period of time.
- Churn Rate: Measures the rate at which users stop using a product or service.
- Lifetime Value (LTV): Measures the estimated revenue that a customer will generate for a business over the entire time they use the product or service.
- Net Promoter Score (NPS): Measures customer satisfaction and loyalty by asking users to rate their likelihood of recommending a product or service to others.
Each of these metrics provides a different perspective on customer engagement and health and can be used to complement or supplement the information provided by the DAU/MAU ratio. The best metric(s) to use will depend on the specific goals and needs of the business.
The Power of the DAU/MAU Ratio for Customer Success#
By tracking the DAU/MAU ratio, businesses can better understand and improve customer satisfaction. For example, if a business sees a drop in the DAU/MAU ratio, it can take steps to improve customer engagement and satisfaction by offering promotions or new features. On the other hand, if a business sees an increase in the DAU/MAU ratio, it can capitalize on customer satisfaction by offering additional products or services.
The Power of the DAU/MAU Ratio for Business#
The DAU/MAU ratio also provides valuable insights for businesses looking for growth. A high DAU/MAU ratio is a good indicator that a business's products or services are in demand, allowing for opportunities for growth and expansion. A low DAU/MAU ratio, on the other hand, may indicate that it's time for a business to reconsider its offerings or strategy.
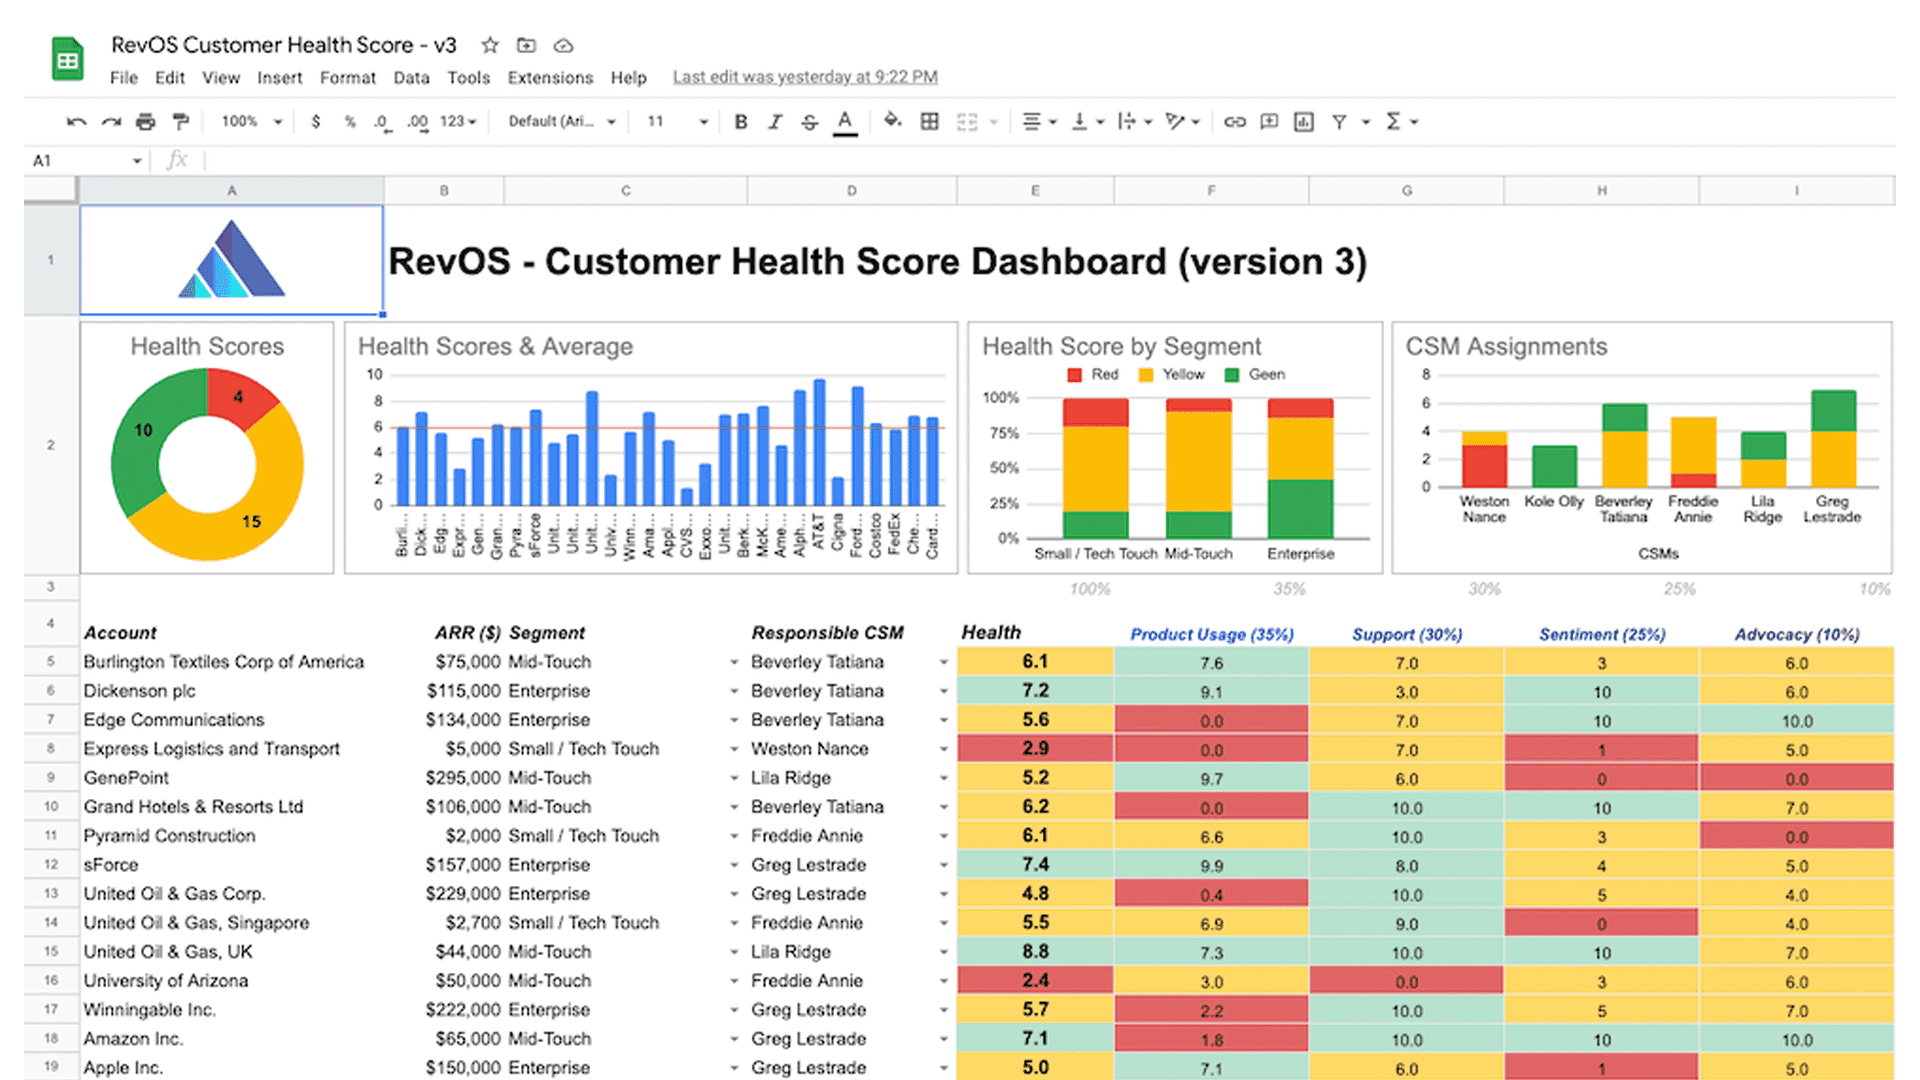
Want to put this in practice? Our Customer Health Score template is a free Google Sheets and Excel spreadsheet that tracks DAU/MAU alongside WAU/MAU, retention, churn, NPS, and the other engagement signals discussed above. Download it, plug in your data, and start scoring customer health in minutes — or skip the manual build with the RevOS Customer Health Score use case, which feeds the same signals straight from your CRM and product data.
FAQ#
What is DAU/MAU?#
DAU stands for Daily Active Users and MAU for Monthly Active Users. The DAU/MAU ratio is the percentage of monthly users who also engage with the product on any given day. It is the most widely used measure of product stickiness — how habitual the product is for its user base.
What is a good DAU/MAU ratio?#
Benchmarks vary by category. For consumer apps with daily-use intent (social, messaging, news, games), 50%+ is world-class. For most software and B2B SaaS, 20–50% is healthy. Products designed for infrequent use — tax software, travel booking, real-estate tools — typically run under 20%, and that is expected, not a problem.
How do you calculate DAU/MAU?#
DAU/MAU = (Average Daily Active Users ÷ Monthly Active Users) × 100. DAU is the number of unique users active in a single 24-hour window, typically averaged across your reporting period. MAU is unique users active in the trailing 30 days.
What is the difference between DAU and MAU?#
DAU counts unique users in a single day; MAU counts unique users across a 30-day window. The ratio of one to the other reveals how frequently your monthly users actually come back — which is a far better measure of engagement than either number alone.
What is the difference between DAU/MAU and WAU/MAU?#
Both measure stickiness but at different cadences. DAU/MAU answers "do users come back daily?" — relevant for messaging, social, and news apps. WAU/MAU answers "do users come back weekly?" — better suited for B2B SaaS, content platforms, and tools used consistently but not every single day.
When should I use DAU/MAU instead of WAU/MAU?#
Use DAU/MAU when your product is designed for daily habit — consumer apps, communication tools, news feeds, games. If your product has weekly or task-driven usage patterns (B2B SaaS dashboards, project management, analytics tools), WAU/MAU is the better stickiness measure because DAU/MAU under-rewards you for the days users are intentionally away.
What is a bad DAU/MAU ratio?#
A "bad" DAU/MAU ratio depends entirely on intended usage cadence. For a daily-habit consumer app, anything below 20% suggests retention issues. For a B2B SaaS dashboard that users only need to check weekly, a 10% DAU/MAU is perfectly healthy — and WAU/MAU would be a more meaningful metric to track in its place.
Related customer health metrics#
- Net Promoter Score (NPS)
- Customer Satisfaction Score (CSAT)
- License Utilization
- WAU / MAU ratio
- Customer Effort Score (CES)
- First Contact Resolution (FCR)
- Time to Full Resolution (TFR)
- Time to First Reply (TFR)
Frequently asked questions
- What is DAU/MAU?
- DAU stands for Daily Active Users and MAU for Monthly Active Users. The DAU/MAU ratio is the percentage of monthly users who also engage with the product on any given day. It is the most widely used measure of product stickiness — how habitual the product is for its user base.
- What is a good DAU/MAU ratio?
- Benchmarks vary by category. For consumer apps with daily-use intent (social, messaging, news, games), 50%+ is world-class. For most software and B2B SaaS, 20–50% is healthy. Products designed for infrequent use — tax software, travel booking, real-estate tools — typically run under 20%, and that is expected, not a problem.
- How do you calculate DAU/MAU?
- DAU/MAU = (Average Daily Active Users ÷ Monthly Active Users) × 100. DAU is the number of unique users active in a single 24-hour window, typically averaged across your reporting period. MAU is unique users active in the trailing 30 days.
- What is the difference between DAU and MAU?
- DAU counts unique users in a single day; MAU counts unique users across a 30-day window. The ratio of one to the other reveals how frequently your monthly users actually come back — which is a far better measure of engagement than either number alone.
- What is the difference between DAU/MAU and WAU/MAU?
- Both measure stickiness but at different cadences. DAU/MAU answers "do users come back daily?" — relevant for messaging, social, and news apps. WAU/MAU answers "do users come back weekly?" — better suited for B2B SaaS, content platforms, and tools used consistently but not every single day.
- When should I use DAU/MAU instead of WAU/MAU?
- Use DAU/MAU when your product is designed for daily habit — consumer apps, communication tools, news feeds, games. If your product has weekly or task-driven usage patterns (B2B SaaS dashboards, project management, analytics tools), WAU/MAU is the better stickiness measure because DAU/MAU under-rewards you for the days users are intentionally away.
- What is a bad DAU/MAU ratio?
- A "bad" DAU/MAU ratio depends entirely on intended usage cadence. For a daily-habit consumer app, anything below 20% suggests retention issues. For a B2B SaaS dashboard that users only need to check weekly, a 10% DAU/MAU is perfectly healthy — and WAU/MAU would be a more meaningful metric to track in its place.
Read more about revenue operations, growth strategies, and metrics in our blog and follow us on LinkedIn and Youtube.
All articles