Evaluating Predictive Potential: How to Determine the Readiness of Your Data for Machine Learning
Introduction
The rise of Large Language Models (LLMs) such as ChatGPT has reshaped how organizations think about artificial intelligence. These systems can generate text, summarize knowledge, and even simulate reasoning — but they don’t replace one essential truth:
AI is only as good as the data behind it.
While LLMs rely on massive and general datasets, most business AI projects depend on specific, structured company data to make predictions, forecasts, or recommendations. When that data is incomplete or poorly structured, the result can be inaccurate models — or even hallucinations, where AI confidently produces results that are simply wrong.
Before investing in AI, every organization should ask:
Is our data ready to support reliable, explainable machine learning?
This guide will help you assess your data’s predictive potential — the extent to which your existing information can generate meaningful, trustworthy predictions.
Step 1: Understand What “Predictive Potential” Means

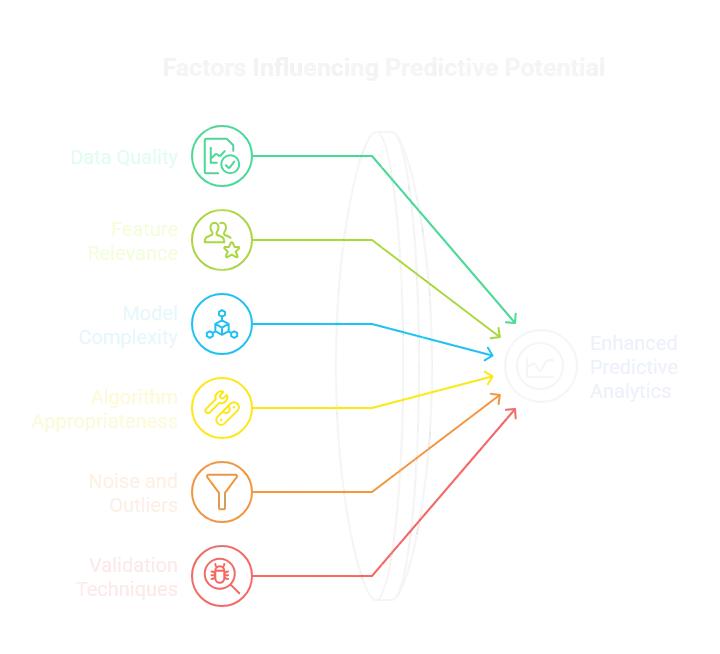
Your data’s predictive potential describes its ability to uncover patterns that explain or forecast key business outcomes. Before analyzing any data, clarify what exactly you want to predict and why it matters.
Key considerations:
- The KPI must tie directly to business impact.
- For revenue-focused teams, the most relevant KPIs are often top-line or bottom-line metrics such as revenue growth, pipeline conversion rate, or operational savings.
- The closer the KPI is to a business result, the easier the internal alignment.
Step 2: Review and Clean the Data

Every successful AI project begins with clean, consistent, and relevant data.
Start by:
- Removing duplicates and resolving inconsistencies
- Standardizing formats and data types
- Filling missing values where possible
- Ensuring sufficient historical depth and granularity
Step 3: Identify the Key Indicators That Drive Your KPI
Once your data is clean and structured, the next step is to identify the key indicators — or features — that have the strongest influence on your target KPI. This is the stage where exploratory data analysis (EDA) meets feature engineering.
Common methods used in this stage include:
- Exploratory Data Analysis (EDA) using tools such as Python’s
pandas,matplotlib, or Power BI’s data profiling features.
- Correlation and dependency analysis, for example Pearson or Spearman correlation, to identify linear and monotonic relationships between variables and the target KPI.
- Feature importance scoring, applying techniques such as Random Forest feature importance, permutation importance, or SHAP values to quantify which features most affect model outputs.
- Dimensionality reduction techniques like PCA (Principal Component Analysis) or t-SNE to visualize and understand relationships in high-dimensional data.
These analytical approaches help you discover which parameters truly drive your KPI — and which are just noise.
For example:
- In marketing, key drivers might include campaign source, channel engagement rate, or customer lifetime value (CLV).
- In sales forecasting, indicators often include deal stage velocity, average contract size, or lead scoring metrics.
- In operations or logistics, predictors could be delivery time, order volume, route distance, or workforce utilization rate.
Step 4: Test and Evaluate Machine Learning Algorithms
With your key indicators defined, you can begin prototype modeling — the practical test of whether your data can support predictive algorithms in a stable and explainable way.
At this stage, the objective is validation of feasibility, not production deployment. The goal is to determine:
Can your data produce a reliable predictive signal strong enough to justify full-scale model training?
At this stage, we benchmark different machine learning models such as regression, classification, or tree-based methods (e.g., Linear Regression, Random Forest, XGBoost) depending on the prediction goal. For time-series forecasting, models like Prophet or LSTM networks are often tested.

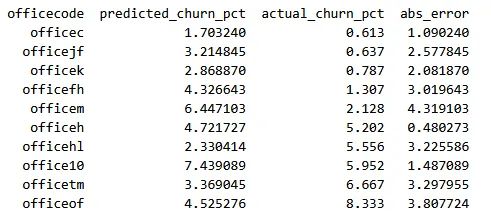
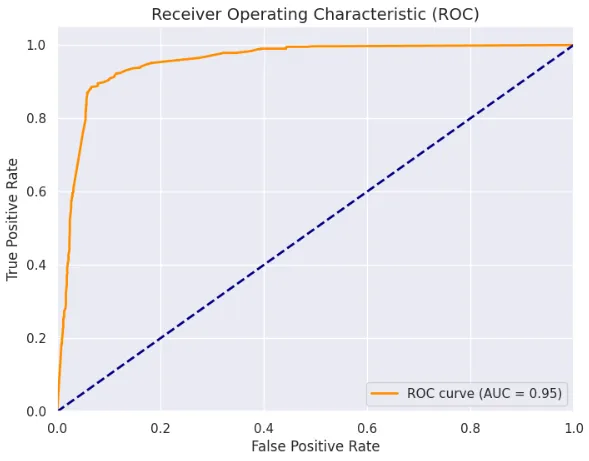
Each prototype is trained on cleaned datasets and evaluated using relevant performance metrics such as RMSE, R², Accuracy, or AUC-ROC. Cross-validation ensures robustness, while explainability tools like SHAP or LIME help us understand feature influence and prevent “black-box” results.

The goal at this stage is simple: validate feasibility — confirming whether your data can deliver stable, meaningful predictions before scaling toward production or RevOS integration.
How We Do It at RevOS AI
At RevOS, we’ve designed a proven approach to assess and demonstrate your data’s predictive readiness through a structured feasibility project.

The process concludes with a comprehensive Feasibility Report, which includes:
- A clear overview of your data’s predictive potential
- Insights into the strongest drivers of your target KPI
- Results from prototype model performance tests
- Practical recommendations for improving data quality or advancing to production modeling
Based on these findings, we typically see one of three outcomes:
- Data not yet sufficient – Key gaps must be filled before prediction is feasible.
- Data sufficient but requiring refinement – Showing potential, but specific improvements will enhance reliability.
- Data ready for immediate embedding – Suitable for direct integration into RevOS, where predictions can feed Actions, alerts, or operational dashboards.
Conclusion: Build Your Foundation for Predictive Success
AI innovations like ChatGPT have shown how powerful machine learning can be — but they’ve also created a dangerous illusion: that more data automatically leads to better decisions.
In reality, most organizations today are drowning in data while starving for insight. Petabytes of logs, transactions, and customer interactions are being collected every day, yet few companies can say with confidence which of these data points actually influence business outcomes. More data doesn’t equal more intelligence — only the right data does.
That’s why understanding your data’s predictive potential is so crucial. It’s not about volume; it’s about relevance, structure, and statistical significance. The organizations that learn to distinguish between data that informs decisions and data that only clutters dashboards will define the next decade of business performance.
By defining measurable KPIs, cleaning and structuring your data, identifying key drivers, and testing prototype models, you create an environment where AI becomes a decision partner, not a guess generator. The outcome is not just predictive accuracy, but organizational intelligence — where every forecast, every dashboard, every action is grounded in evidence.
We’re approaching a turning point: companies that can use data to predict and adapt will move faster, operate smarter, and outcompete those that can’t. The divide won’t be between those who have data and those who don’t — it will be between those who can use it meaningfully and those who can’t.
Speak with a RevOS expert and receive a tailored predictive potential assessment for your organization.
At RevOS AI, we help forward-thinking organizations make this leap — transforming raw data into predictive power and intuition into measurable foresight. Because in the next era of business, data literacy isn’t optional — it’s survival.
Read more about revenue operations, growth strategies, and metrics in our blog and follow us on LinkedIn, Youtube, and Facebook.
← Go back to blog